Tool Fragmentation
Bloomberg for data. ASX for PDFs. Excel for plotting. PowerPoint for output. None of them talk to each other.
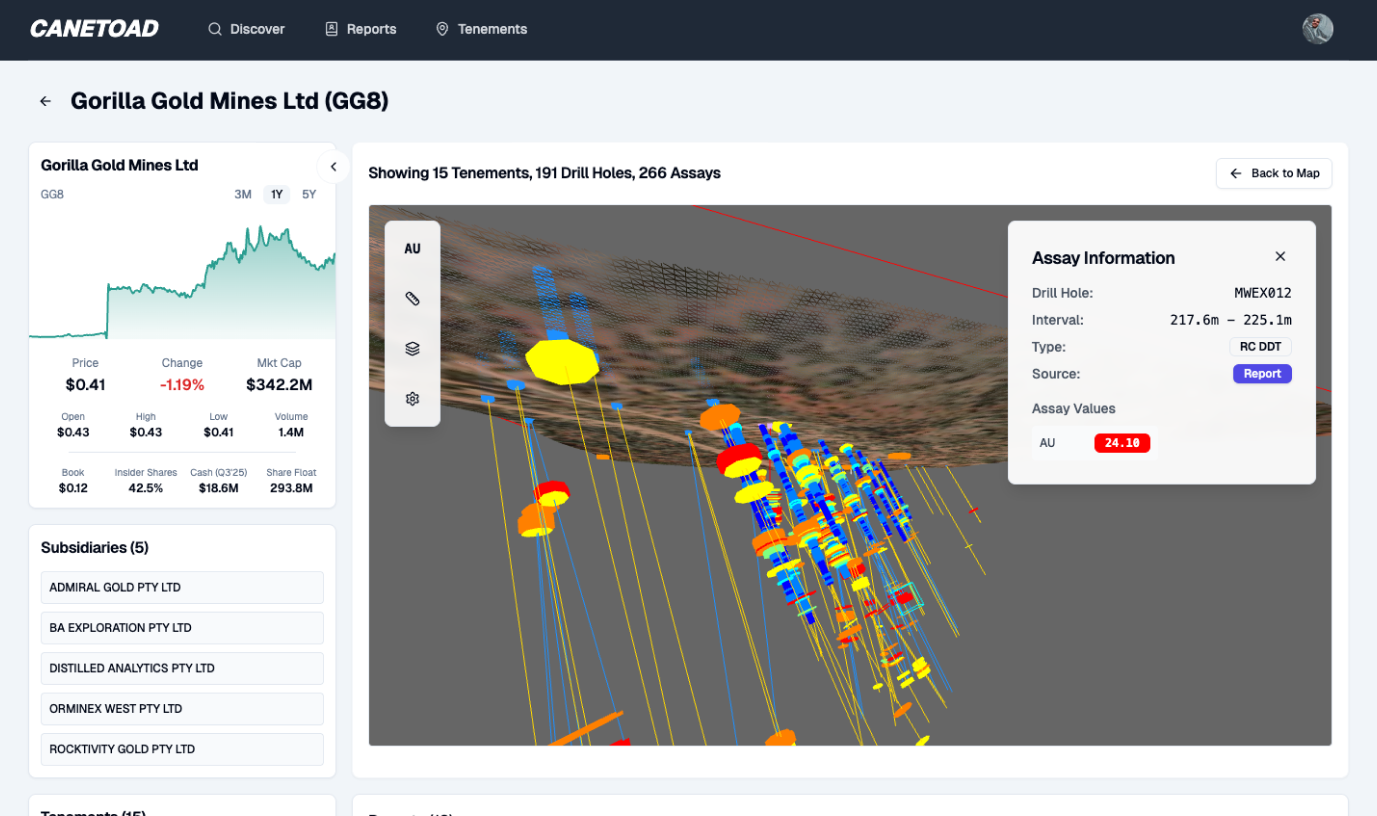
One surface for ingestion, visualisation, analysis, and output
Mining research analysts toggle between Bloomberg (market data), the ASX website (announcements), Excel (data compilation), PowerPoint (presentations), and sometimes GIS software — none designed for integrated geological assessment. Each tool switch loses context. Data doesn't flow between them. The analyst becomes the integration layer, manually copying coordinates from PDFs into spreadsheets into presentations. Canetoad unifies ingestion, 3D spatial analysis, cross-section tools, timeline context, and output into a single evidence surface.
No GIS learning curve required
Some analysts at larger firms have occasional access to Leapfrog or QGIS. Most don't — and even those who do find the learning curve too steep for rapid announcement assessment. Canetoad's spatial tools are designed for the specific workflow of evaluating drill results from ASX announcements. You don't need to know about shapefiles, projections, or geological modelling conventions. You need to know whether the structure is coherent, and the tools show you directly.
Evidence flows from ingestion to output without manual copying
The worst consequence of tool fragmentation isn't just wasted time — it's lost evidence fidelity. Every time you copy a coordinate from a PDF into Excel, or screenshot a GIS view into PowerPoint, information degrades. Context is lost. Source links break. Canetoad maintains evidence integrity from ingestion (raw ASX data) through analysis (3D/section/timeline) to output (shareable views, source-linked briefs). Nothing is manually transcribed. Nothing is lost.
"We use Canetoad to find new projects quickly because the data is current and fast." It keeps our first-pass process disciplined.
Jade Smith · Analyst
Get actionable insights today.
Start using Canetoad today to get actionable insights from ASX mining announcements. Get the edge on the market.