Campaign Context Decay
By the time the next announcement lands, you've forgotten what the last one showed.
Persistent campaign memory across every company you follow
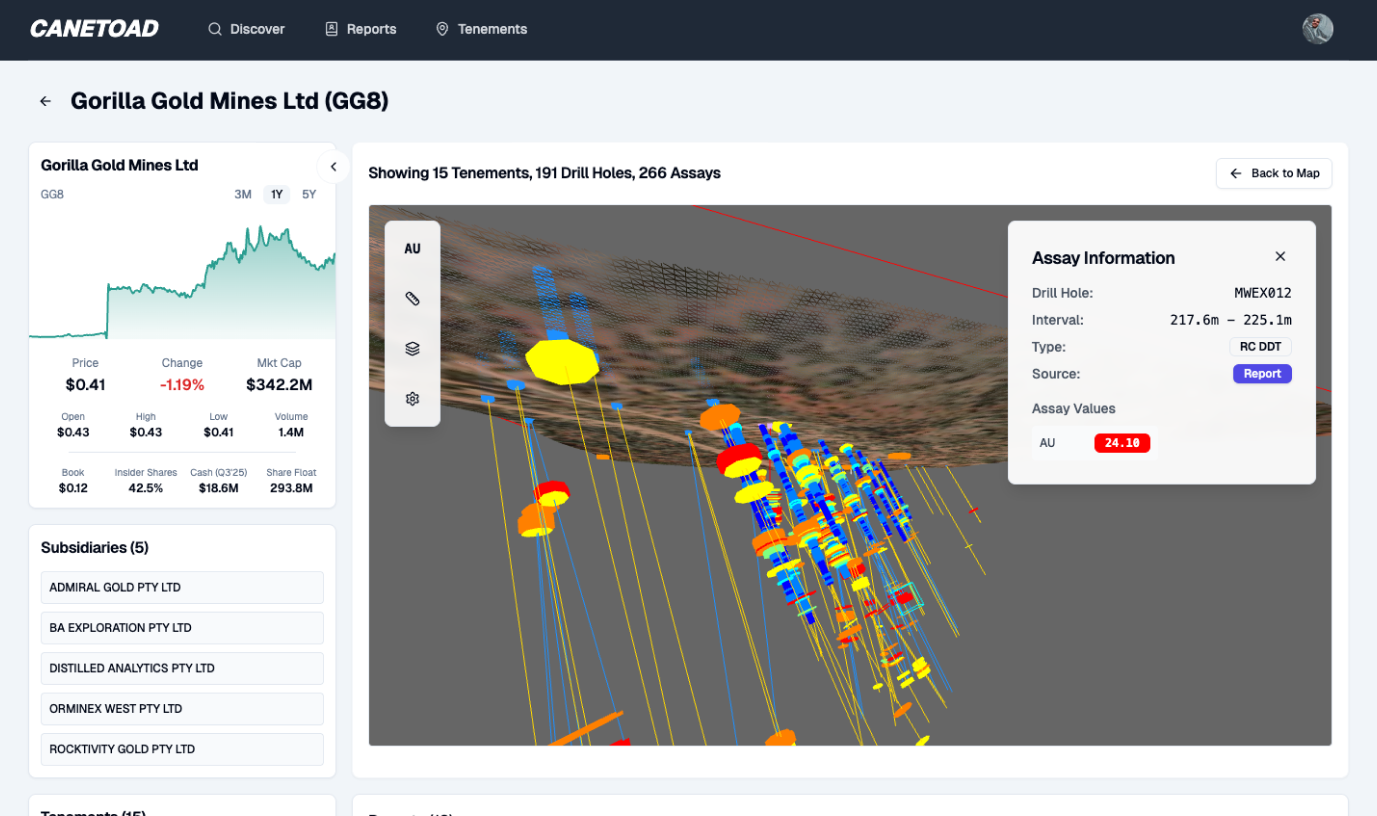
Exploration campaigns unfold over months and years. But announcements arrive as disconnected PDFs, and your memory of what came before degrades between quarterly cycles. When the next drill result lands, you're mentally rebuilding context from scratch — or worse, relying on the company's curated summary of their own progress. Canetoad maintains a persistent spatial database for every company. Each announcement enriches the existing picture. When new results arrive, you see them in full historical context — previous holes, campaign direction, structural evolution — without opening a single old PDF.
Detect pivots and narrative shifts before the market notices
Did drilling quietly shift from the main discovery zone to a peripheral target? Has the campaign accelerated or stalled? Is the company reframing disappointing results as "expanding the exploration footprint"? These patterns are invisible when you read announcements in isolation but become unmistakable when you watch the campaign unfold chronologically in spatial context.
Track 10–50 companies without context collapse
Most mining investors track multiple names simultaneously. Maintaining campaign context across a 20-stock watchlist using PDFs and memory is functionally impossible. Every time you switch focus, context resets. Canetoad's persistent database means you can return to any company and immediately see the full accumulated campaign — no rebuild required.
"The Time Slider showed me that new hits were lining up with older holes." The market missed the continuous structure, but that visual became my buy signal.
Institutional Investor · Perth
Get actionable insights today.
Start using Canetoad today to get actionable insights from ASX mining announcements. Get the edge on the market.